Here's a quick look at what's new:
- Specter Landscapes 🗺️
- Historical Growth Charts 📈

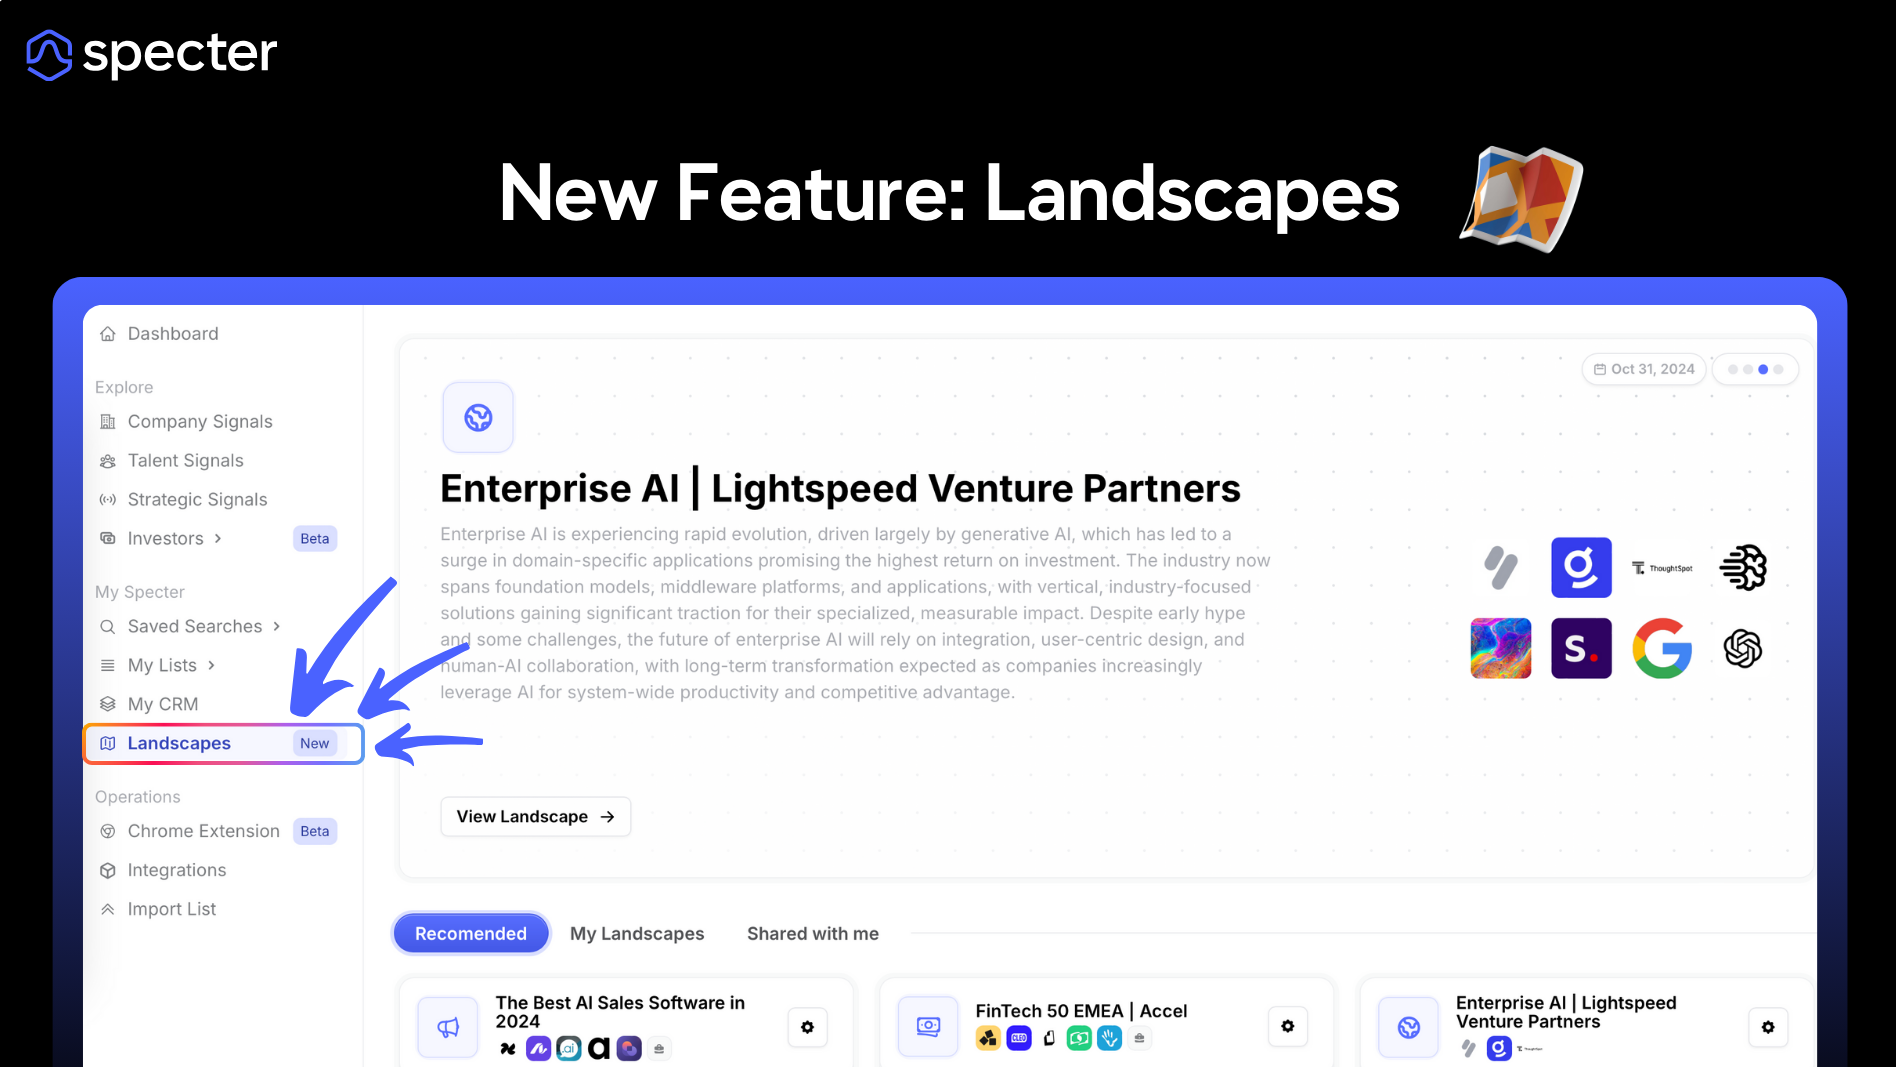
Introducing Specter Landscapes 🗺️
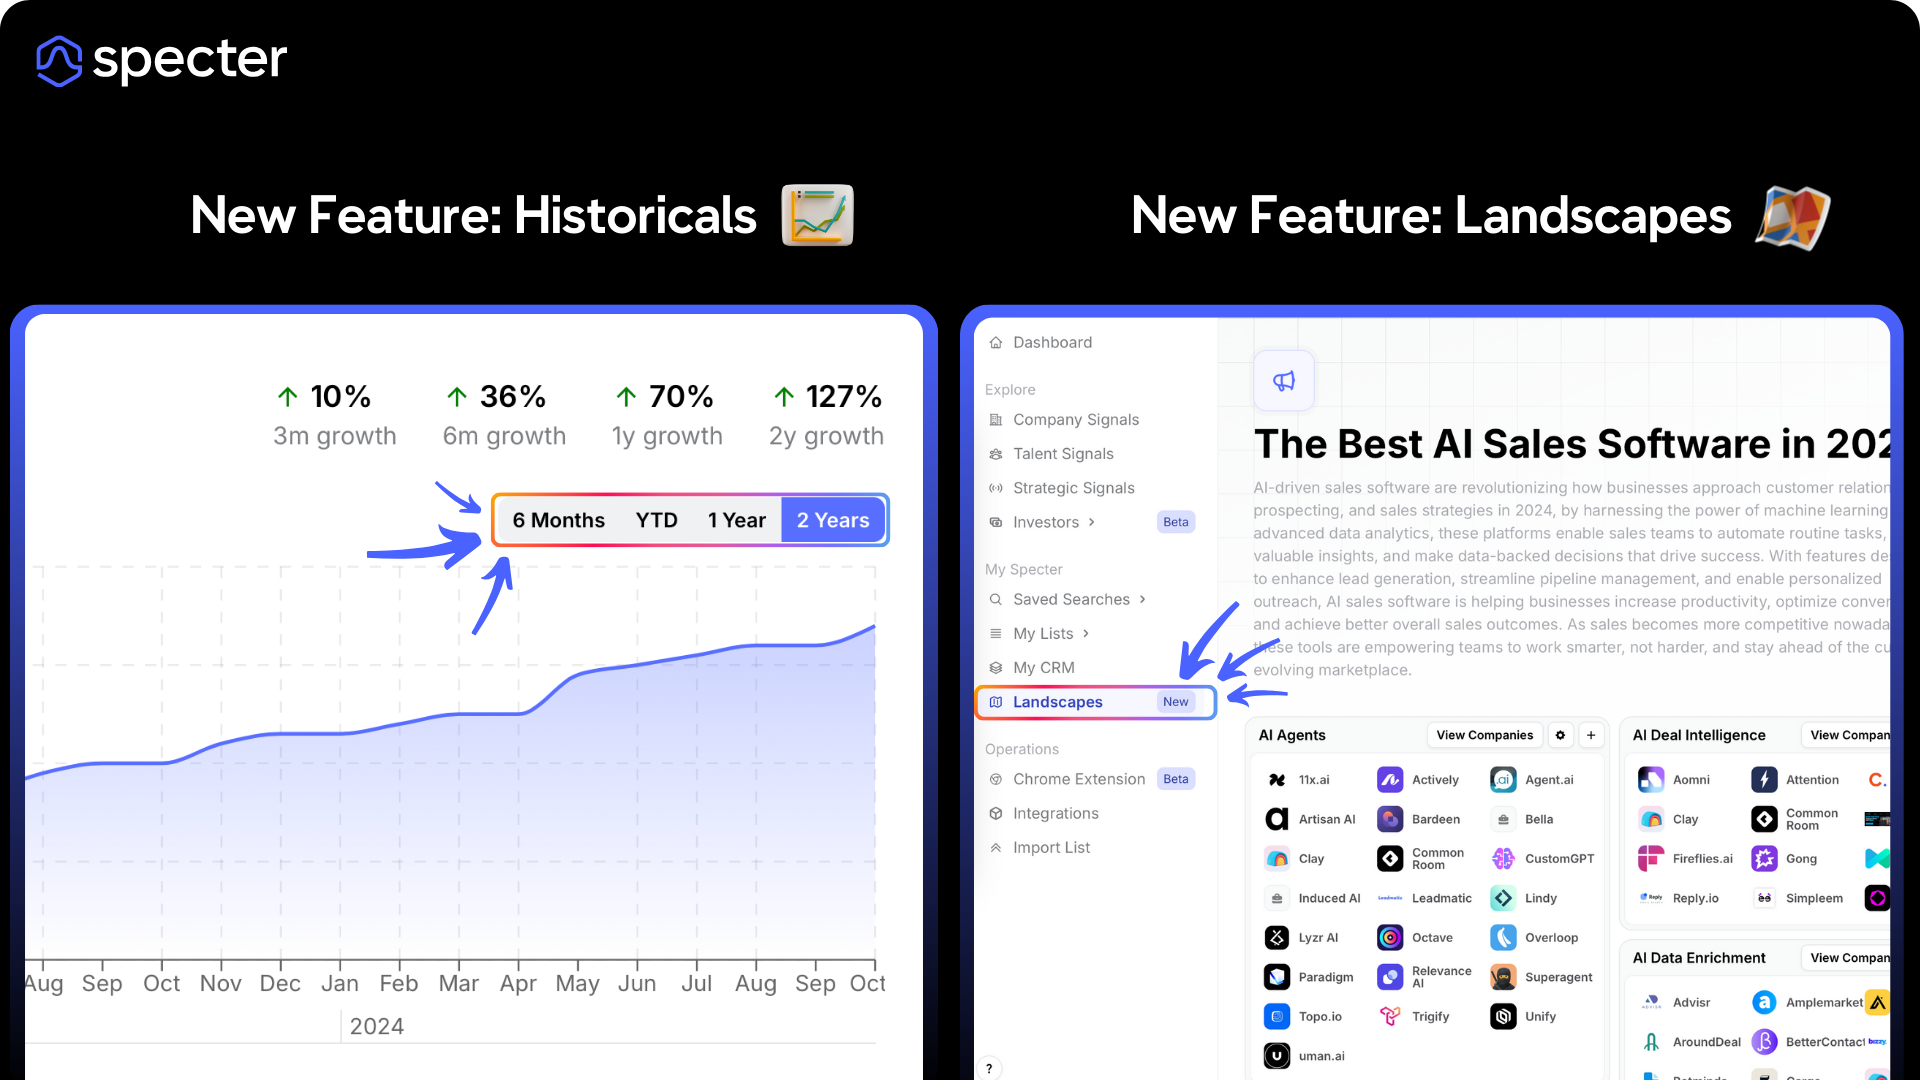
Specter’s new market mapping tool empowers you to analyze industries, market segments, or geographic regions like never before. Whether you use our expertly Recommended Landscapes or design your own, this feature puts actionable insights at your fingertips.
What Makes Landscapes Powerful?
Recommended Market Maps
Specter offers Recommended Landscapes that are either built by us or replicate trusted market maps from top investors and insiders. For example Specter's The Best AI Sales Software in 2024 or Accel's FinTech 50 EMEA. You can use these Landscapes to:
- Spot emerging opportunities in hot sectors.
- Stay updated on competitive dynamics in key markets.
Create Your Own Market Maps
You can build and tailor Landscapes to your specific needs by:
- Selecting metrics that matter (e.g., growth highlights, funding, headcount).
- Customizing layouts and data order.
- Focusing on insights that align with your team’s strategy.
Collaborative Power and Deeper Industry Insights
- No need to manually collect or organise data—Specter streamlines the process, giving you faster access to market research.
- Whether you’re scouting deals, benchmarking competitors, or refining your thesis, customisable mapping ensures your strategies align with market realities.
- Collaborate with your colleagues on Shared Landscapes to easily identify market gaps, evaluate trends, and gain a competitive edge with comprehensive data visualization.

Specter Historical Growth Charts 📊
We're excited to announce a long-awaited update to our Historical Charts on Specter! You now have access to two full years of historical data for key metrics—enabling deeper trend analysis, uncovering seasonal patterns, and providing stronger context to validate growth consistency and benchmark companies over time.

Key Benefits:
Spot Long-Term Trends
- Two years of data allows you to spot longer-term growth patterns, seasonality, and key milestones that may have been missed with a shorter timeline.
Enhanced Context for Decision-Making
- Understand how a company has adapted over time by seeing its trajectory through a broader lens—ideal for evaluating resilience or long-term momentum.
Identify Cyclical or Seasonal Patterns
- With two years of data, you can uncover annual cycles or seasonal dips and peaks, which are critical for planning and timing investment decisions.
Better Benchmarking Against Competitors
- Compare companies on a more equal playing field by examining their performance over an extended timeline, revealing trends that short-term data cannot.
Stronger Validation for Investment Theses
- Longer historical data provides the evidence needed to validate growth consistency and sustainability, helping you build stronger, data-backed theses.

Exciting Updates Ahead 🎁
As we approach Thanksgiving, we want to extend our gratitude to our clients and partners in the US—your support drives everything we do at Specter. 🦃
But we’re not done yet! We have even more exciting features lined up, and you can expect some big announcements just in time for the holidays. 🎄✨
Thank you for being a part of the Specter community. Stay tuned—there’s so much more to come!


